1 Introduction
1.1 Data Models
All data is an abstraction… a sample… a way of representing some aspect of the real world. We cannot capture everything. A data model is a way to conceptualize data. You can think of these as themes in how data is represented.
With spatial data we typically divide data sets into two data models: Vector Data and Raster Data. We’ll explore these in greater depth in this workshop.
1.2 File Formats
A data model is related to the concept of a file format. Every data model has at least one file format (and usually several file formats) to store data.
For example, consider a nonspatial data model, the text document. This data model is a file containing text characters. You have a number of options for file formats when you save a text document, including a Word Document (.docx), text file (.txt), Google Doc, and Libre Office File. All of these file types store the same critical thing - text - but each may support additional features like text formatting or inclusion of images. Internally, they may store information in different ways, and each file format may differ in human readability (Can you open the file with any text editor or do you need a specific program like Libre Office for it to work?), but they all share a similar way of representing information - text.
Spatial data models are ways of abstracting the world and each has a set of file formats associated with it. For example, vector data may be saved as a shapefile (.shp), geopackage (.gpkg), or as a comma separated variable (.csv), just to name a few. We’ll explore this in more detail later as well.
1.3 Why?
Why do we need to know about different spatial data models and data formats? Can’t our computers tell what the data is and handle it automatically?
When we use spatial data, we need to know what model it uses so we can make good decisions about how to analyze it efficiently. Knowing the model and structure gives us intuition about how we can work with the data inside any given file.
When we make spatial data, we need to choose a model and file format that will represent the real world with the highest degree of accuracy for the intended use case.
1.4 The Big Picture
Spatial Data is usually composed of two parts:
- Geometry = The location of the data, where it is in space
- Attributes = Information about the locations
A quick note about the geometry: we are simplifying a bit here. Geometries not only contain locations but also require a coordinate reference system (also known as a projection). Data typically comes with a coordinate reference system already defined, so we’ll deal with this concept another day. For more on this topic, see DataLab’s Coordinate Reference Systems Workshop.
You’re probably already familiar with the idea of locations with attribute information from apps on your phone or other map-based information sources that are so common today. Let’s take a look at an example of a website that helps users find gas stations, GasBuddy:
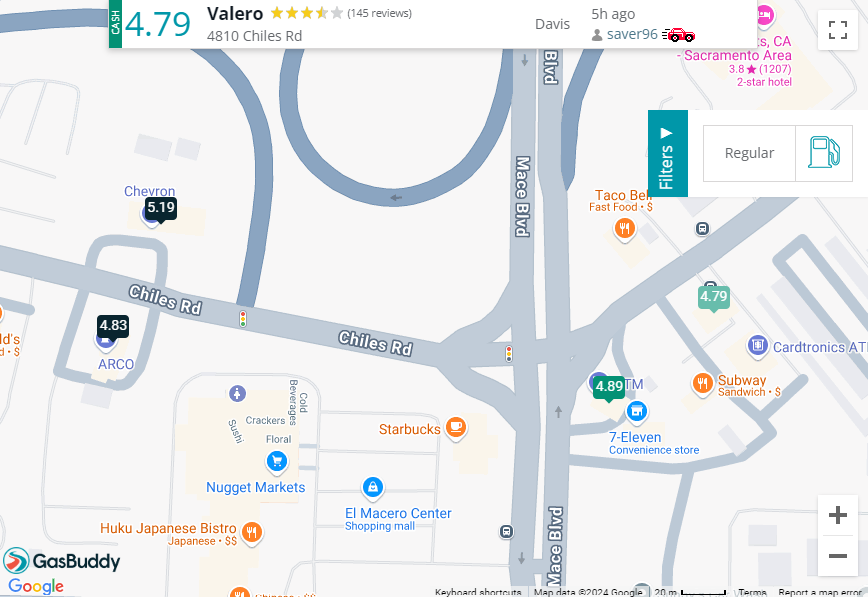
Above: Screenshot of GasBuddy showing 4 gas station locations with their prices
Each gas station location is indicated with a marker showing the price of gas, but you can also click on the marker to learn even more about the station - the name, address, rating, and when the price was last updated.
All spatial data uses this format - location + attribute information - but how the information is structured depends on the data model and the file format you store the data in.
Let’s dig into some more specifics of each data model!