3. Daily Habits for Everyone#
3.1. Keep a Research Log#
Writing is a primary mechanism for doing research, not just for reporting it.
– paraphrased from Simon Peyton Jones, computer scientist
You’re part of a lab working on a research project that began three years ago. When you were introducing a new graduate student to the project this morning, they asked whether the lab considered investigating treatment Z, because they’ve seen lots of excitement about it in recent literature. You remember mentioning treatment Z to the principal investigator a few years ago and eventually deciding not to pursue it, but can’t remember when or why you made that decision. Now you’re wondering whether your decision was too hasty and reviewers will question why treatment Z wasn’t considered. If only you had detailed notes to refresh your memory as to why treatment Z isn’t relevant.
A research log is a collection of running notes about your progress on your research project. You can set up one or more notes documents when you set up your project. Use the notes to keep track of things you’ve tried, things you want to try, decisions, relevant references, and more. If you have collaborators, take notes about your meetings. Record anything there’s a chance you’ll want to remember later: results (positive or negative), new ideas, new leads, decisions, changes of plan, action items, and scheduling details.
When you start a notes document, make sure to consider whether you’ll need to include figures, code, or other media, and choose an appropriate format. Paper notes are convenient for diagramming and doodling, and can be digitized after the fact to share with the team. Digital notes are convenient for collaborating with team members who aren’t physically present, and can be shared as they are being written.
For Collaboration
Put some thought into what note-taking methods work best for everyone engaged with the project. It’s good to share notes with the entire team, so that everyone can contribute and misunderstandings can be corrected quickly, unless your research topic or data require restricting access.
Take notes during meetings. Some people like to take notes during meetings, while others prefer to take summary notes immediately after, so that they can be fully engaged. Collaborating on notes or rotating who takes notes in each meeting can help lessen the burden, but having a designated note-taker can help ensure consistency.
One way to keep your notes digitally is to use electronic lab notebook (ELN) software, which provide a searchable interface for entering notes. Most ELNs automatically capture metadata about notes, such as the date and time they were written, and can also store experimental data. Some also have other features, such as file storage and sharing, version control, and publishing tools. Depending on your discipline and research topic, you might be expected or required to use a specific ELN system.
See also
See the Electronic Lab Notebooks section of the UC Davis Library’s Research Data Management guide to learn more about ELNs.
Another way to keep notes digitally is to use issue tracking software. Issue tracking software were originally created to keep track of and help organize work to be done, or “issues”, in (large) software development projects. However, most work equally well for keeping track of work in computational research projects. Services such as [GitHub][], [GitLab][], and Tangled provide issue tracking.
See also
See the Working with GitHub section of DataLab’s Git for Teams workshop reader to learn more about issue tracking.
3.1.1. Document Every Experiment#
Note
An “experiment” doesn’t necessarily have to be an experiment done in a lab. Doing an experiment could mean running a simulation, testing a model, or something else.
In your notes, keep a record of every experiment that you do. Document parameters, the results, and anything else you think is relevant for:
Repeating experiments in the future. Research projects are often iterative—you may need to repeat an experiment to make adjustments to a few parameters or because you discovered a bug in your code.
Comparing across experiments. Think of the documentation as a high-level overview of your project. Use it to get a sense of which experiments had promising results, which didn’t, and which you might want to try next.
Avoiding redundant work. By keeping track of what’s already been done, you can avoid accidentally and unnecessarily repeating an experiment that you or your collaborators have already done.
Get in the habit of recording experiments as soon as you start to plan them, and recording the results as soon as they finish. Assign a unique name or number to each experiment so that you can reference specific experiments in your other notes and files. If you have collaborators, make sure they can access the documentation and understand how to use it.
Tip
ELNs or spreadsheets are often a good format for this kind of documentation, since they’re convenient for data entry.
3.2. Write & Maintain READMEs#
A README is one of the most important documents in your research project.
The README introduces and explains a project, or the contents of a specific
directory within a project. READMEs should generally be plain-text (.txt) or
Markdown (.md) file format because these are non-proprietary formats meaning
they are accessible to anyone with a text editor regardless of their operating
system and environment. READMEs help people—including future you—discover,
understand, and use your project. Thus READMEs are one of the most important
documents you can write to make your work reproducible.
Tip
Each time you start a new project, create a new directory for the project. Use this project directory to store all files related to the project. This directory is sometimes also called the top-level directory for the project, since all other directories and files for the project exist beneath it.
Establish a Directory Structure elaborates on this idea.
A project should always have a README in the top-level directory that serves as an introduction to the entire research project. This top-level README will often be the first thing someone new to the project sees. At a minimum, the top-level README should contain:
The project title
A brief description of the project
A list of the project contributors and their affiliations
A primary contact (typically a name and email address)
A list of links to any other project resources, including data sets and papers, that are stored or accessed separately
For projects with data or code, the top-level README should also contain instructions for relevant software installation and code use. To learn more about this see Document the Workflows).
A top-level README is usually sufficient documentation for projects with a shallow directory structure, and where the methodology is published elsewhere (such as in linkable journal articles or technical reports). For projects with a deep directory structure, additional READMEs in important directories can be helpful for navigating their contents. For projects with technical details that are not explained elsewhere, it’s a good idea to provide additional documentation in the form of READMEs or other files, such as file manifests and data dictionaries (see below).
See also
See DataLab’s README, Write Me! workshop reader for more about how to write READMEs.
3.2.1. File Manifests#
It’s good practice to include a file manifest in your project README, and whenever you share files. A file manifest is a description of the files and directories in a project. This list is analogous to the shipping manifest on a box your receive in the mail. Just as the shipping manifest lists all the items in the box, the file manifest lists all files in a project directory. A file manifest serves two important purposes:
It describes which files and directories are supposed to be included with the project. If you, a collaborator, or an outside researcher thinks they might be missing a file, consulting the file manifest is one way they can verify this.
It documents the purpose of each directory (and often, each file).
A good file manifest will list the directories in alphabetical order, followed by all files in alphabetical order. A manifest should also show the directory hierarchy through indentation, symbols, or both. Here’s an example of a manifest from a DataLab project:
data/           Models and images
docs/           Notes on the project as well as environment setup
log/            Slurm log files
src/            Image preprocessing, model training, and analysis
STEGO/          Code for creating STEGO models
tests/          Scripts for testing workflows, examining outputs, etc.
toy_data/       Very (very!) small pieces of data for dev testing
If a directory contains many files or subdirectories, you might consider writing a separate file manifest specifically for that directory.
3.3. Document the Data#
Metadata, or data that describes data, is critical to the research process. It delineates how the data were collected, what assumptions were made, what biases might be present, any ethical concerns, the overall structure, what each observation means, what each feature means, and more. Good data documentation guides researchers towards appropriate, responsible use of the data for both the current and future studies.
Good metadata should answer the questions who, what, when, where, why, and how about your data. How your metadata answers these questions will depend on conventions in your field of research. If you are submitting your data to a particular data repository, it will likely have a required metadata scheme you will need to follow. Otherwise, pick a metadata scheme that aligns with other researchers in your field. If you have to submit a Data Management Plan, it will specifically ask how you will apply and adhere to field specific data standards. For more information about Data Management Plans, see the UC Davis Library’s Data Management Research Guide and the California Digital Library’s DMPTool
If you aren’t sure what the standard is in your field, there are several online repositories to help you out. The Metadata Standards Catalog has a fairly exhaustive list of metadata schemes, which you can browse by subject. Fairsharing.org also stores metadata and other documentation standards. By using an existing community standard metadata scheme, you make it possible for future researchers (including you!) to compare your data to data from other, heterogeneous, sources.
Note
Many metadata resources include a controlled vocabulary. This is a list of specific values, each with a predefined meaning. It is designed to provide consistency and uniqueness across data sources. One common example of a controlled vocabulary is a list of geographic names, like the Thesaurus of Geographic Names (TGN). There are many ways you can refer to New York City (NYC, the Big Apple, Manhattan etc). But if you want to be able to group together all data about New York City, it is helpful if everyone calls it the same thing.
Even if you don’t know where your data will end up, documenting your data when you collect it will help ensure your documentation doesn’t have any gaps. Timely documentation also maximizes the likelihood that your research can be reproduced, as well as reused by other researchers increasing your overall research impact. If your project uses data collected earlier or by someone else, it’s a good practice to fill gaps in the existing documentation with your own. Thorough documentation isn’t just beneficial to other researchers, it’s also beneficial to future you. Small details you notice and document can be important later in the project.
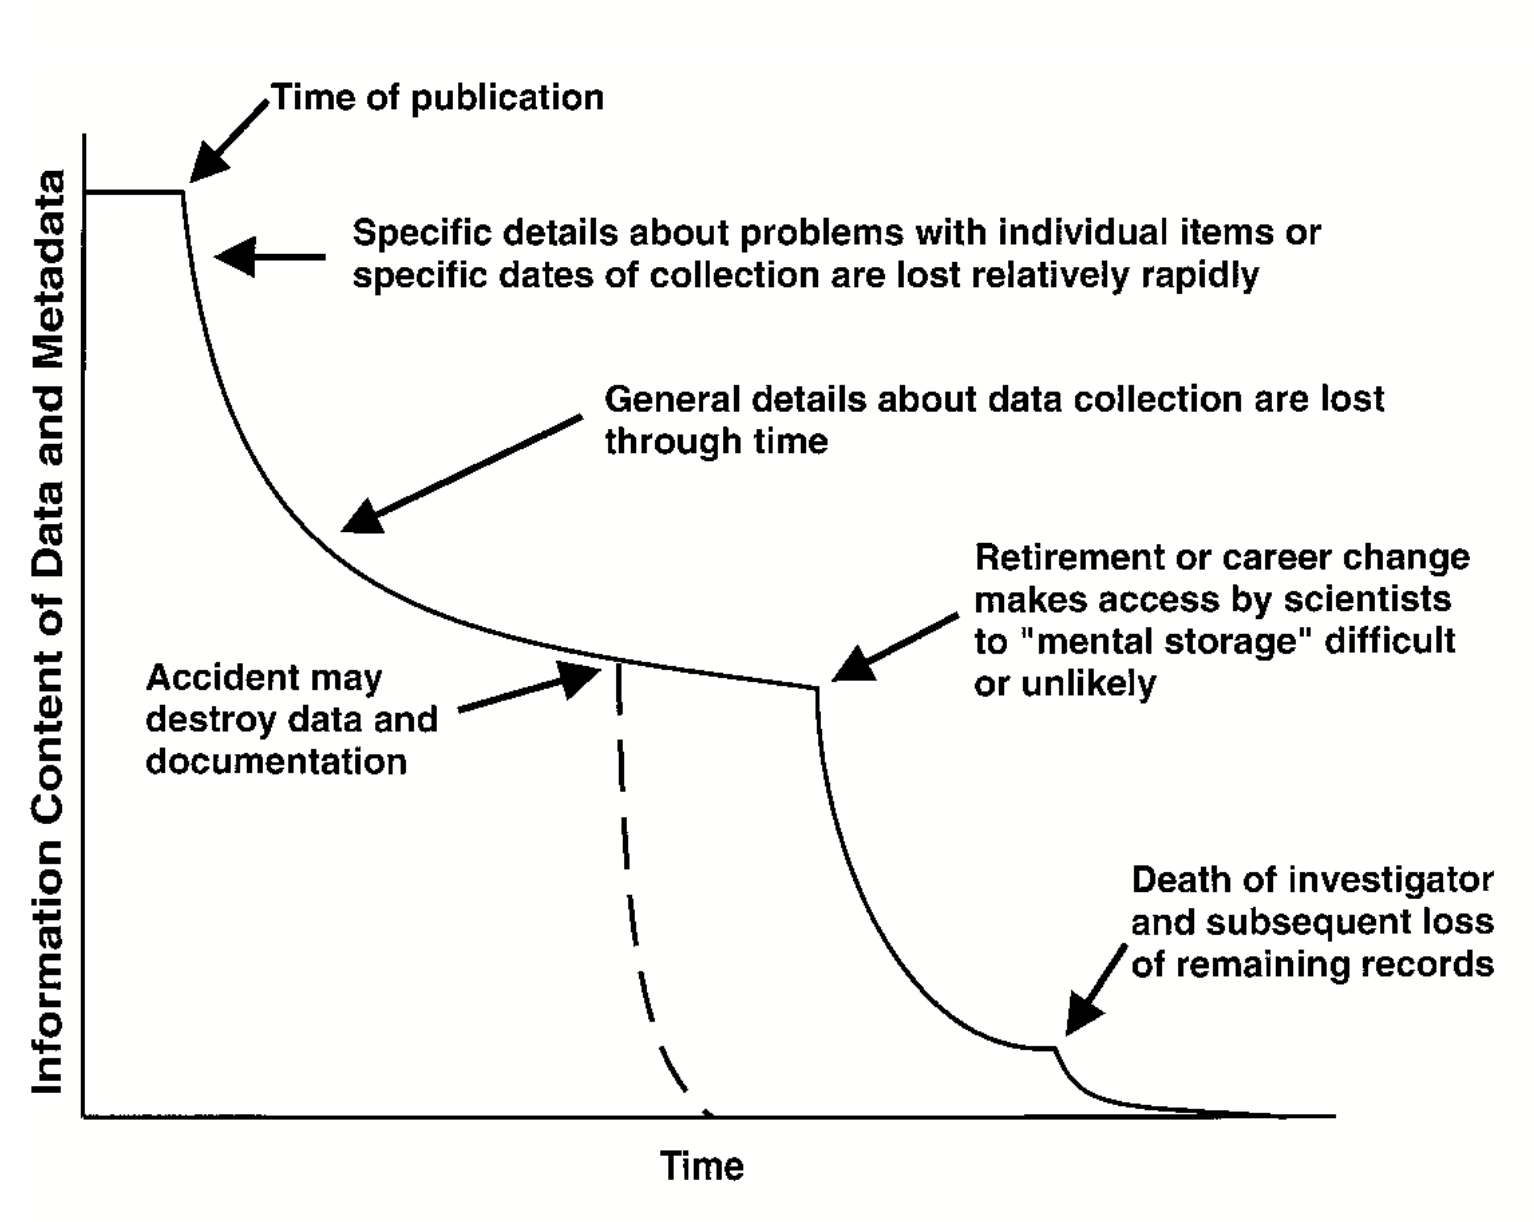
Fig. 3.1 Information Entropy (Figure 1) from (Michener et al. 1997) © 1997 by the Ecological Society of America.#
Note
One of the simplest and most widely used metadata standards is the Dublin Core, a set of 15 metadata elements originally defined at a 1995 workshop in Dublin, Ohio. The exact definition of the Dublin Core elements can be a bit technical, but the University College Dublin (Ireland) Library provides simplified explanations and examples here.
If all of this seems overwhelming, that’s okay. The Consortium of European Social Science Data Archives (CESSDA) has a great introductory video for those who have never documented data before. CESSDA also provides detailed explanations of what information to document at both project and data level in their Data Management Expert Guide. This includes detailed information about documenting quantitative and qualitative data. Just make sure to expand all the collapsed sections.
See also
There are many resouces on documenting your data available. Here are a selection of them:
University College Dublin on Metadata and Documentation
3.3.1. Create a Data Dictionary#
A data dictionary, part of your metadata, is a document that explains what every field or element in your dataset means as well as any restrictions on their values. This includes things like the data type (ex. number, date, text, boolean), and whether that field can be missing. The more information you include, the more helpful it will be down the line (see Captain Obvious). Data dictionaries are the most efficient way to communicate the structure and content of your data to other collaborators, including future you! A very basic one could look like this:
Field Name |
Field Description |
Data Type |
Notes |
|---|---|---|---|
person_id |
autogenerated by database |
integer |
|
name |
legal full name (family name, given name) |
string |
|
occupation |
A person’s job or vocation |
string |
Must come from the Bureau of Labor Statistics Occupation List |
… |
… |
… |
… |
If you aren’t sure where to start with creating a data dictionary, DataLab has a template you can use as a jumping off point. If you prefer step by step instructions, Kristin Briney’s Create a Data Dictionary exercise might be for you. Open Science Framework (OSF) has resources on what details to add to your data dictionary, and the USGS provides many examples of data dictionaries and how they are used in different contexts. If you are working with multiple data sets, make sure to clarify which data dictionary to use with each data set.
If your dataset looks less like a series of rows and columns, and more like a long list of files, consider creating a data inventory instead. A data inventory should include the author or source, title, publication year and DOI (if published), and file name for each file, and can include more file metadata as necessary. For example, a data inventory for works of fiction in the public domain could look something like this.
Author |
Title |
Year |
Filename |
|---|---|---|---|
Bronte,Charlotte |
JaneEyre |
1847 |
EN_1847_BronteCharlotte_JaneEyre.txt |
Austen,Jane |
SenseandSensibility |
1811 |
EN_1811_AustenJane_SenseandSensibility.txt |
Wollstonecraft,Mary |
Maria |
1798 |
EN_1798_WollstonecraftMary_Maria.txt |
… |
… |
… |
… |
If you also need to keep track of things like the provenance or license associated with each file or data set, DataLab’s data inventory template provides a comprehensive starting point.
If your data uses numbers, acronyms, or abbreviations to store information, you should include a codebook in your metadata. Like a data dictionary, a codebook lists all of the variables in a data set. However, a codebook also lists the meaning of each value (or code) for each variable. For example, it is very common to store biological sex as a binary variable where the values are either 0 or 1. The codebook for such a data set would tell you that 0=male and 1=female for the sex variable.
See also
See OSF and the Research Data Management Workbook for how to create a data dictionary, UC Davis DataLab for data dictionary and data inventory templates, and USGS for examples.
3.4. Document the Methods#
You can think of your methods like a recipe you might use for cooking or baking. A good recipe clearly documents the steps so that you can reliably produce the same result (if you follow the recipe!). But, imagine a recipe that doesn’t give clear measurements or uses obscure or outdated units (“use a pony of oil”), or gives vague instructions (“bake the cake for a bit”), or uses overly technical terminology or language (“be sure to autolyse your bread”). Any of these would make it very difficult for someone to reliably make the recipe.
The same is true of your research methodology. You should make sure that you document your methods in such a way that someone else (or future you) can reliably recreate your experiment and/or results. Good things to consider including:
Make and model of probes, analyzers, questionnaires, or other instruments used
Realistic expected ranges of the data (e.g., 100s of nanograms vs thousands of milligrams vs 10s of kilograms)
Quality Assuracnce\Quality Control protocols (QA/QC)
Reagents and standards (and their respective concentrations and manufacturers)
References to established protocols (e.g., EPA methods)
Descriptions of qualitative data collection methods
Standard Operating Proceedures (SOPs) for your research group
You can also document your methods using cloud tools that explicitly enable sharing:
Tip
Consider {ref} ‘PREREGISTRATION_SECTION’ to make your methods even more reproducible!
3.5. Make Backups#
You’ve made a plan to backup your work (Plan for Backups), now make sure you do it early and often!
3.6. Save Clean Data#
Treat data cleaning and data analysis as distinct and equally important steps in the research process. Write code to clean the data, and document why each cleaning step was taken, so that cleaning is reproducible. Save a copy of the clean data to use in analyses. This way:
Cleaning is consistent across all analyses.
You only need to run the cleaning step once. For some data sets, cleaning is a time-consuming and expensive computation.
Cleaning and analysis concerns are kept separate, which makes it easier to write simple code with clear goals.
You can use different languages or software for the cleaning step and the analyses.
What it means for data to be “clean” will depend on your project’s specific data sources and analysis goals. Nevertheless, here are some things you should almost always do:
Check that the structure of the data is appropriate. For instance, many tools for analyzing tabular data require tidy data, where each row is an observation and each column is a feature.
Check that the types of the data are appropriate. In other words, make sure the language or software you plan to use recognizes data for what they are. For instance, dates often need to be explicitly converted to a date type.
Investigate missing data. It’s crucial to have a thorough understanding of what’s missing before moving to analysis. If you decide to remove or fill in missing data, do so cautiously; it’s not always necessary and can bias analyses.
Investigate extreme data and erroneous data. As with missing data, it’s important to understand the outliers in your data.
See also
See DataLab’s Intermediate R: Cleaning & Reshaping Data workshop reader to learn how to clean data in R.
3.7. Use a Citation Manager#
You will likely find a great deal of literature (journal articles, reports, etc.) that you will need to keep organized. Citation managers (like Zotero, EndNote, Lean Library, and many others) can help with this. Modern citation managers have browser extensions that can pull articles right from your web browser into your citation manager in a single click. They also offer a variety of oraganizational techniques ranging from collection folders to tagging systems. Most also integrate with Microsoft Word, Google Docs, or LibreOffice to help manage your bibliography while writing. They aren’t perfect and you need to check their work but they can save you a lot of time. They also assist with collaborations because you can have a shared library with collaborators that you can all add papers to.
You can learn more about the citation managers available at UCD here. They all have pros and cons. And if you need support choosing or working with one you can consult with a librarian anytime!
Tip
While there are several free options listed on the Library guide, note that
Zotero is an open source tool. That means that Zotero will travel with you
if/when you leave UC Davis. Also see the
3.8. Use Version Control#
Version control is the act of tracking changes to your files. By capturing and timestamping all changes to the project files, version control allows for a complete audit and reconstruction of the project and is thus a cornerstone of reproducibility practices. Projects that use version control allow you to follow the exact course of the research from original data to analysis, interpretation, and final product as well as identify exactly when and why a specific file or result changed. There are a few common version control systems that you can use to track changes to your research files, including your documentation, code, and data.
3.8.1. Manual Version Control#
You may already be saving copies of files with different names as a kind of
ad-hoc version control system. This could look like using a standardized file
name convention that includes a keyword denoting the topic of the file combined
with a date or project milestone indicating when the file was last modified.
For example, the names of the copies could look like essay_2025_12_01.doc and
essay_2025_12_31.doc if using calendar dates to denote changes, or
essay_edited.doc, essay_final.doc, essay_final_for_real.doc, and so on if
using project milestones. However, making multiple copies of a file and
applying standardized naming conventions to track changes is error prone and
can make it challenging to identify what exactly is different across the
copies. It also requires more space as you are saving multiple full copies
every file you modify. Thus, using cloud-based tools with or software that
automate version control for your files is preferred whenever possible.
3.8.2. Cloud-Based Version Control#
Cloud-based office suites such as Microsoft 365 OneDrive, Google Office and Box include built-in version history features that allow you to revert to older versions of a file. This version control system can work effectively, assuming you have access to the platform and are able to store all your work there. It also requires you, and anyone else working on the file, to have reliable internet access. A disadvantage of these services is that they typically save documents in proprietary formats that may not be accessible to some people, and they do not necessarily preserve version information when you download a document from the cloud to work with it locally on your machine. These cloud services also facilitate collaboration, assuming all members of the team have access to the tools. For an open-source, desktop-based alternative, consider using LibreOffice, which also has version control built-in.
3.8.3. Version Control Software#
The most consistent and precise approach is to use software specifically designed for version control. In computing contexts, when people say “version control,” it’s often implied that they mean a version control system that uses software designed for that purpose. In addition to helping you keep track of different versions of files, most modern version control software can also help you share and collaborate on files with others. The most common version control software and cloud sharing platform are Git and GitHub.
Version control systems for code first appeared in the 1960s and are now widely considered an essential part of every programmer’s toolkit. One reason for this is that code is usually developed incrementally: you write code for a new feature, run tests to make sure it works, make corrections, and repeat, until you can move on to the next feature. Occasionally, you might start to develop a feature and then realize that it just won’t work or that it isn’t worth the effort. In that situation, it’s important to be able to go back to the most recent version of the code before you started working on the feature—which is exactly what version control allows you to do. If you suspect that some changes to your code introduced a bug, you can also use version control to isolate the changes that caused the bug by testing earlier versions. These capabilities also make version control well-suited to research, because you never know when you’ll need to re-run an old experiment or hit a dead end on a particular line of investigation.
Many different version control systems exist, but a recent StackOverflow survey found that about 93% of developers use Git, an open-source distributed version control system. “Distributed” means that Git is flexible about where you store your code; there can be copies of the code on your laptop, on a private server, on a hosting service like [GitHub][], and on your collaborators’ laptops, and Git will help you keep all of them in sync—if that’s what you want. DataLab uses Git for all of our projects, and recommends that you do too.
Note
Git and other version control software can manage versions of all file types. While this software also facilitates direct comparisons across different versions of your documentation and code files so you can quickly and reliably identify exactly what changed, it generally does not track specific changes within spreadsheet, image, and video files.
See also
See the UC Davis Library’s Research Data Management Guide for an overview of version control systems, and DataLab’s Introduction to Version Control workshop reader for a technical introduction to version control with Git.
Note
[Markdown][] is a lightweight markup language that provides basic formatting options, is supported by a wide variety of editors and platforms, and can be used to produce publication-quality documents with open-source tools like Pandoc. Because Markdown is a plain-text format, anyone with a text editor can read a Markdown document, and you can manage versions with the same version control systems available for code. For a more richer markup language that produces publication-quality documents out-of-the-box, but has many of the same advantages as Markdown, consider LaTeX.