4 Graphical Elements of a Plot
4.1 Marks and Channels
A data visualization is useful only if it encodes information in a way that our eyes can perceive and our brain can understand. Marks and channels are the building blocks of all data visualizations and are employed to accomplish this encoding.
Marks are the the basic geometries, or graphical elements, in a plot that depict our data items or their linkages. Marks indicate “where” something is and include points (0d), lines (1d), areas (2d), and volumes (3d).
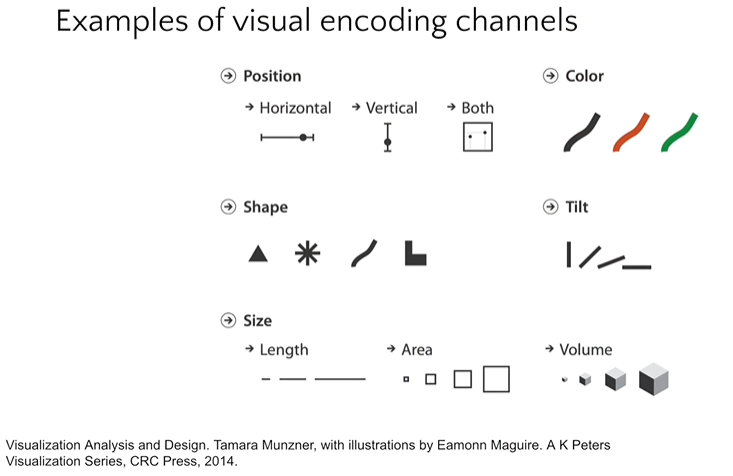
Channels are the attributes of that control how the marks appear. Channels are used to encode (or indicate) the values or meaning of our data. Channels were first described in the mid-20th century by Jacques Bertin in his book Semilogie graphique (the Semiology of Graphics [1967]), which argues that visual perception operates according to rules that can be followed to express information visually in intuitive, accurate and efficient ways. He described seven main categories of visual variables (channels): location or position, size, shape, orientation, color, and texture. More recent publications list up to 12 channels useful for encoding meaning in data visualizations (Roth 2017).
By understanding the nature of our data in combination with the principles of visual perception, we can decide which marks and channels to use for a given data visualizations.