11 Introduction to Datasets
After this lesson, you should be able to:
- Explain what it means for a dataset to be “tabular”
- Explain what a “feature” is
- Explain what an “observation” is
- Explain what it means for a dataset to be “tidy”
- Describe some widely-used data types
We teach this lecture with a slide deck. This chapter does not necessarily cover everything covered in lecture.
11.1 Tabular Datasets
The structure of a dataset—its shape and organization—has enormous influence on how difficult it will be to analyze. When you start working with a dataset, examining its structure is one of the first things you should do. This way you can identify and correct potential problems, and prepare the dataset for the analyses you’d like to carry out.
A tabular dataset is one that’s structured as a table, with rows and columns. This reader focuses on tabular datasets, since they’re common in practice and present the fewest programming challenges. Here’s an example of a tabular dataset:
| Fruit | Quantity | Price |
|---|---|---|
| apple | 32 | 1.49 |
| banana | 541 | 0.79 |
| pear | 10 | 1.99 |
Researchers think about datasets in terms of two components:
A feature (also called a covariate) is measurement of something, usually across multiple subjects. For example, we might decide to measure the heights of everyone in the class. Each person in the class is a subject, and the height measurement is a feature. Features don’t have to be quantitative. If we also asked each person their favorite color, then favorite color would be another feature in our dataset. Features are usually, but not always, the columns in a tabular dataset.
An observation is a set of features measured for a single subject or at a single time. So in the preceding example, the combined height and favorite color measurement for one student is one observation. Observations are usually, but not always, the rows in a tabular dataset.
Every dataset has features and observations, regardless of whether the dataset is tabular.
11.2 Tidy Datasets
In 2014, Hadley Wickham refined and formalized the conventions for tabular datasets by introducing the concept of tidy datasets, which have a specific structure. A tabular dataset is tidy if and only if:
- Each observation has its own row.
- Each feature has its own column.
- Each value has its own cell.
These rules ensure that all of the values in a dataset are visually organized and are easy to access in programming languages. They’re specific enough to make tidiness a convenient standard for commands that operate on tabular datasets. They also reflect the way statisticians conventionally arrange tabular datasets.
R’s Tidyverse packages (see Section 14.3) are designed from the ground up for working with tidy datasets. Tidy datasets have also been adopted as a standard in other software, including various packages for Python and Julia.
When you first look at a dataset, think about what the observations are and what the features are. If the dataset comes with documentation, it may help you figure this out. Since this dataset is a tidy dataset, we already know each row is an observation and each column is a feature.
Chapter 21 gives examples of tidy and untidy data, as well as explanations of how to make untidy data tidy.
11.3 Types of Data
Different types of data require different approaches and analysis methods. For example, if your data are numbers, you can summarize them by computing a sum or an average. On the other hand, if your data are categories, like genres of music (rock, pop, classical, …), you can’t use these summarization methods and have to do something else.
Researchers categorize data into types based on sets of shared characteristics. This makes it easier to reason about how to transform, analyze, and present the data. Some widely-understood data types are:
- Categorical
- Nominal - data separated into specific categories, with no order. For example, hair color (red, brown, blonde, …) is categorical.
- Ordinal - data separated into specific categories, with an order. For example, school level (elementary, middle, high, college) is ordinal.
- Numerical
- Discrete - integers, or a finite set of decimal numbers with no values in between. Sometimes discrete values can also be treated as ordinal. For example, month as a number (1, 2, …, 12) is discrete.
- Continuous - decimal numbers. There are no specific categories, but there is an order. For example, height in inches is numerical.
Of course, other types of data, like graphs (networks) and natural language (books, speech, and so on), are also possible. Categorizing data this way is useful for reasoning about which methods to apply to which data.
Because a feature measures something, we often think and talk about types of features rather than types of individual values. For example, for a feature that measures temperature in degrees Celsius, all of the data values will be numeric (and probably continuous). So we can say the feature is numeric.
In a tidy dataset, each feature has its own column, so it also makes sense to talk about the types of the columns.
11.4 Dataset: CA Least Terns
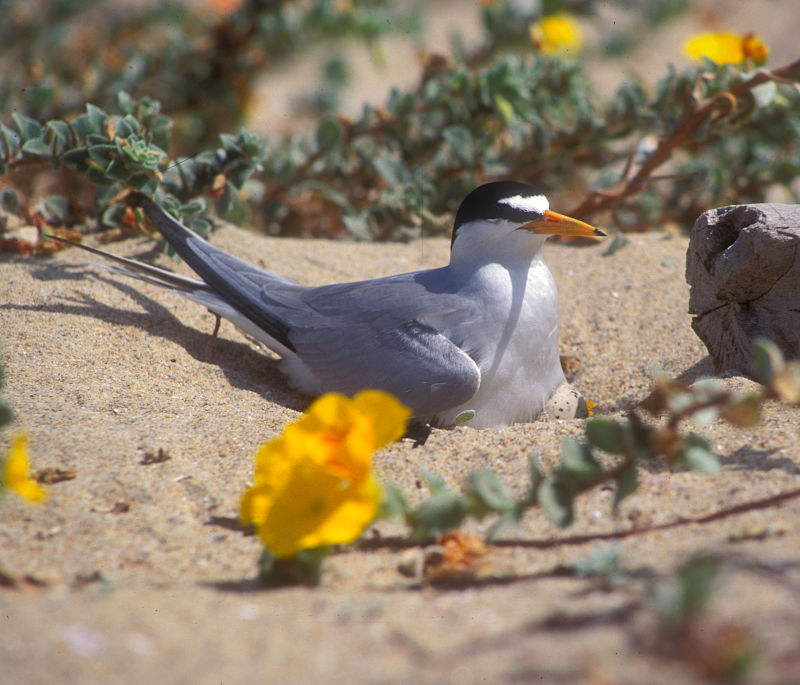
The California least tern is a endangered subspecies of seabird that nests along the coast of California and Mexico. The California Department of Fish and Wildlife (CDFW) monitors least tern nesting sites across the state to estimate breeding pairs, fledglings, and predator activity in each annual breeding season.
The CDFW publishes most of the data it collects to the California Open Data portal. The examples in this and subsequent chapters use a cleaned 2000-2023 version of the California least tern data.
Click here to view the 2000-2023 California least tern dataset.
Each row in the dataset contains measurements from one year-site combination.
| Column | Description |
|---|---|
year |
Year of the breeding season |
site_name |
Site name |
site_name_2013_2018 |
Site name from 2013-2018 |
site_name_1988_2001 |
Site name from 1988-2001 |
site_abbr |
Abbreviated site name |
region_3 |
Region of state: S.F. Bay, Central, or Southern (includes Ventura) |
region_4 |
Region of state: S.F. Bay, Central, Ventura, or Southern |
event |
Climate events |
bp_min |
Reported minimum breeding pairs |
bp_max |
Reported maximum breeding pairs |
fl_min |
Reported minimum fledges |
fl_max |
Reported maximum fledges |
total_nests |
Total reported nests (maximum if a range was reported) |
nonpred_eggs |
Total non-predator-related mortalities of eggs |
nonpred_chicks |
Total non-predator-related mortalities of chicks |
nonpred_fl |
Total non-predator-related mortalities of fledges |
nonpred_ad |
Total non-predator-related mortalities of adults |
pred_control |
Site predator control (yes/no) |
pred_eggs |
Total predator-related mortalities of eggs |
pred_chicks |
Total predator-related mortalities of chicks |
pred_fl |
Total predator-related mortalities of fledges |
pred_ad |
Total predator-related mortalities of adults |
pred_pefa |
Predation by peregrine falcons (yes/no) |
pred_coy_fox |
Predation by coyotes or foxes (yes/no) |
pred_meso |
Predation by other mesocarnivores: dogs, cats, skunks, opossums, raccoons, weasels, etc. (yes/no) |
pred_owlspp |
Predation by owls (yes/no) |
pred_corvid |
Predation by corvids: ravens or crows (yes/no) |
pred_other_raptor |
Predation by raptors other than peregrine falcons and owls (yes/no) |
pred_other_avian |
Predation by birds other than raptors and corvids (yes/no) |
pred_misc |
Predation by other animals (yes/no) |
total_pefa |
Total mortalities due to peregrine falcons |
total_coy_fox |
Total mortalities due to coyotes and foxes |
total_meso |
Total mortalities due to other mesocarnivores |
total_owlspp |
Total mortalities due to owls |
total_corvid |
Total mortalities due to ravens and crows |
total_other_raptor |
Total mortalities due to other raptors |
total_other_avian |
Total mortalities due to other birds |
total_misc |
Total mortalities due to other animals |
first_observed |
Date CA least terns first observed at site |
last_observed |
Date CA least terns last observed at site |
first_nest |
Date first egg observed at site |
first_chick |
Date first chick observed at site |
first_fledge |
Date first fledge observed at site |
The messy source dataset (with more years and more columns) is available here.